

SOP: Post-Test-Run Platform Review and Dashboard Orientation
Key Steps
1. Confirm the test run is complete and use the trial day effectively 0:00
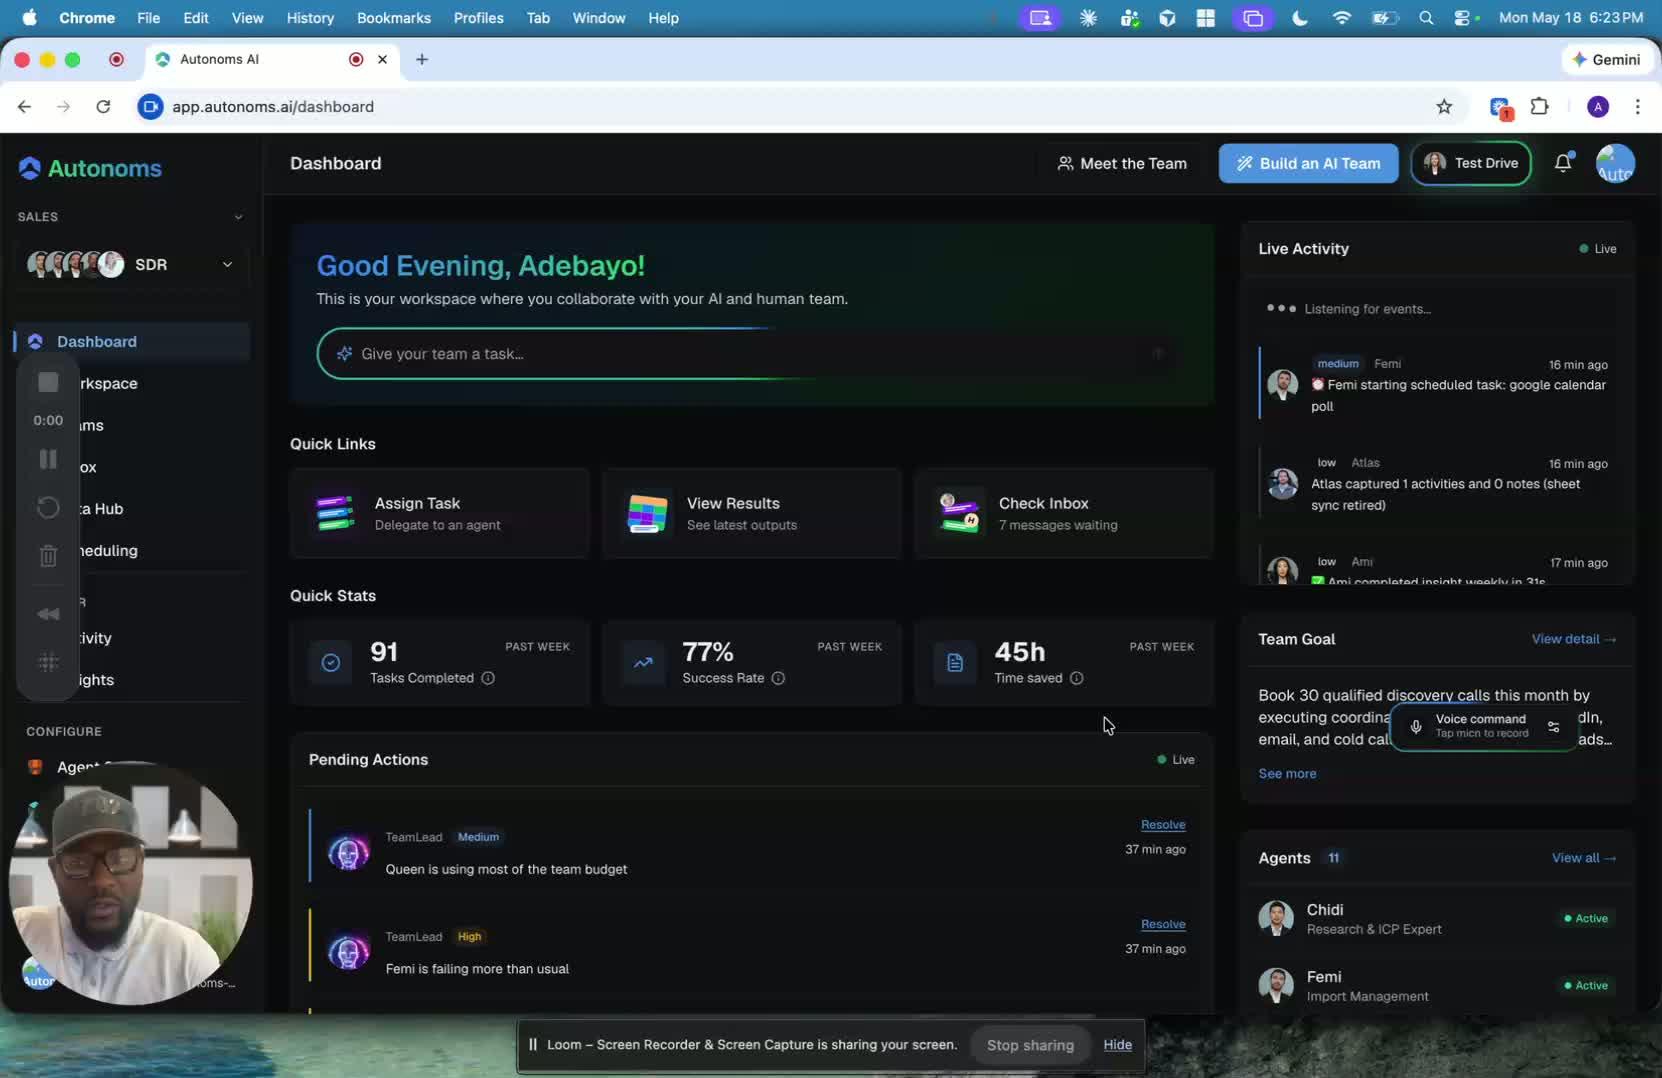
- Verify that the test run has finished successfully.
- Inform the team member that they have one full day to explore the platform before subscribing.
- Use this time to gain a realistic, end-to-end understanding of how the platform works in practice.
- Encourage hands-on exploration rather than passive review so the user can evaluate the system’s fit for their workflow.
2. Understand the purpose and limits of the trial period 0:09
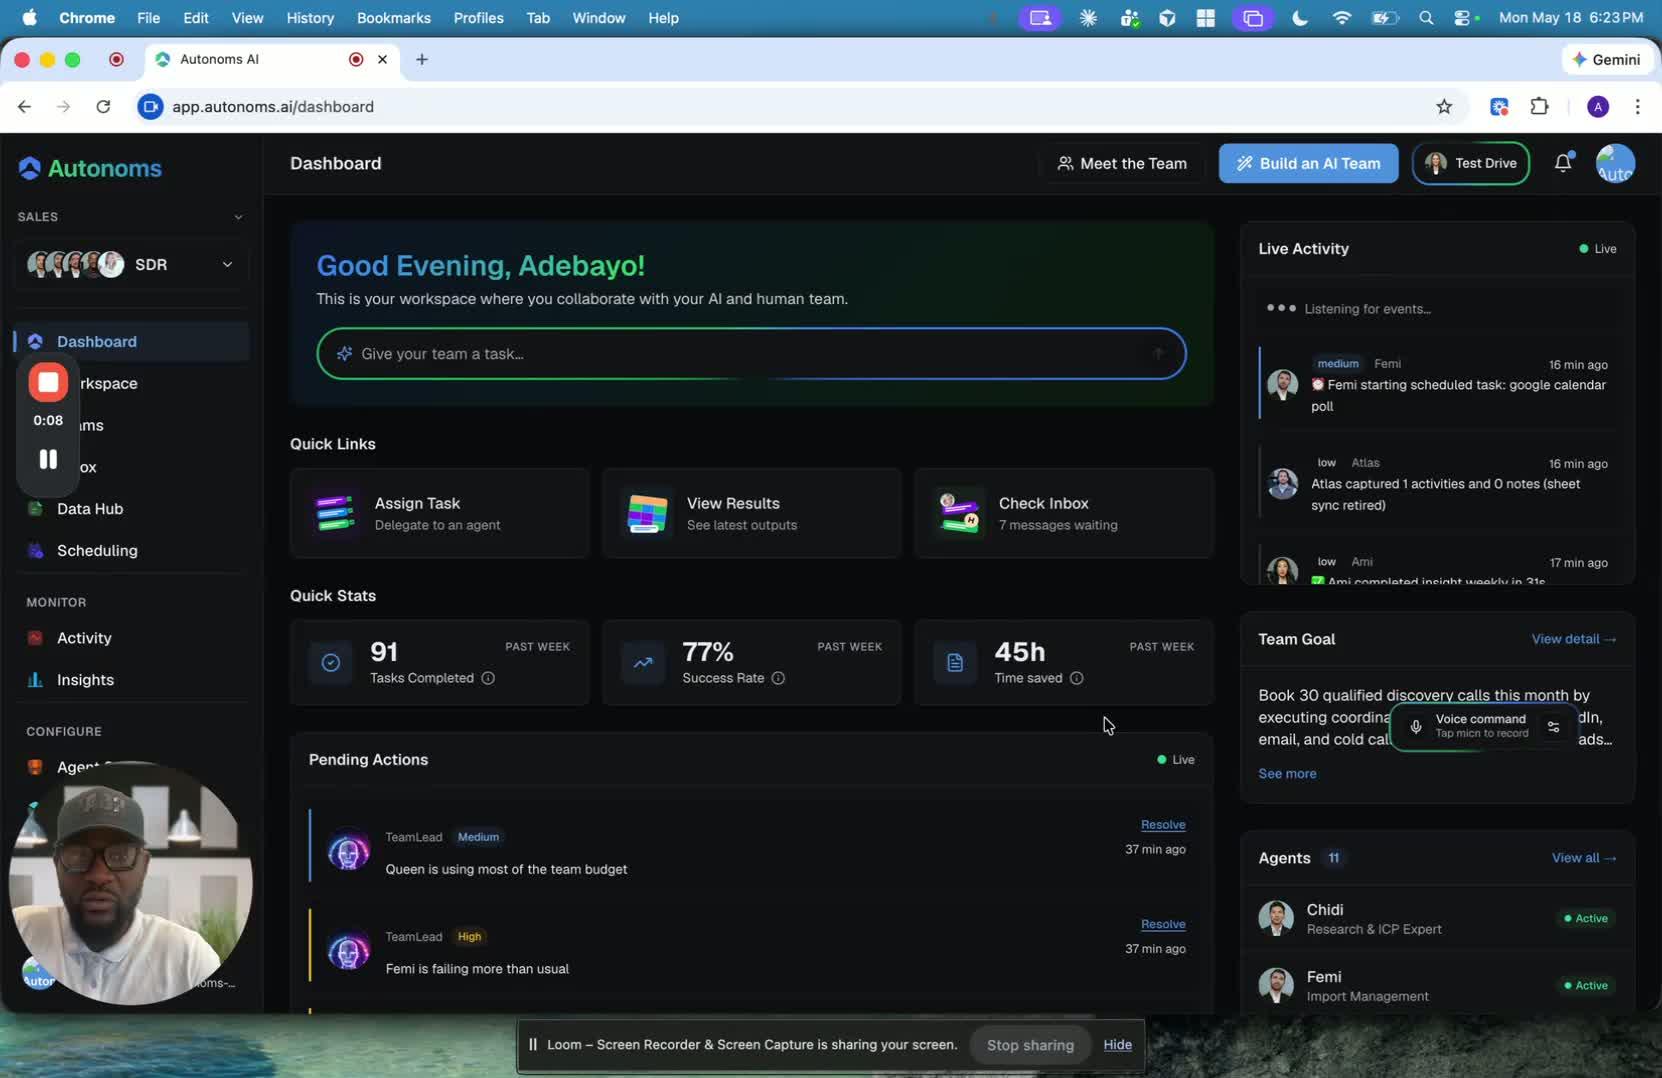
- Explain that the platform is resource-intensive, which is why the free trial is limited.
- Set expectations clearly: the trial is designed for a short, practical evaluation, not long-term use.
- Reinforce that the goal is to assess real-world performance and usability within the available day.
3. Review the dashboard overview 0:25
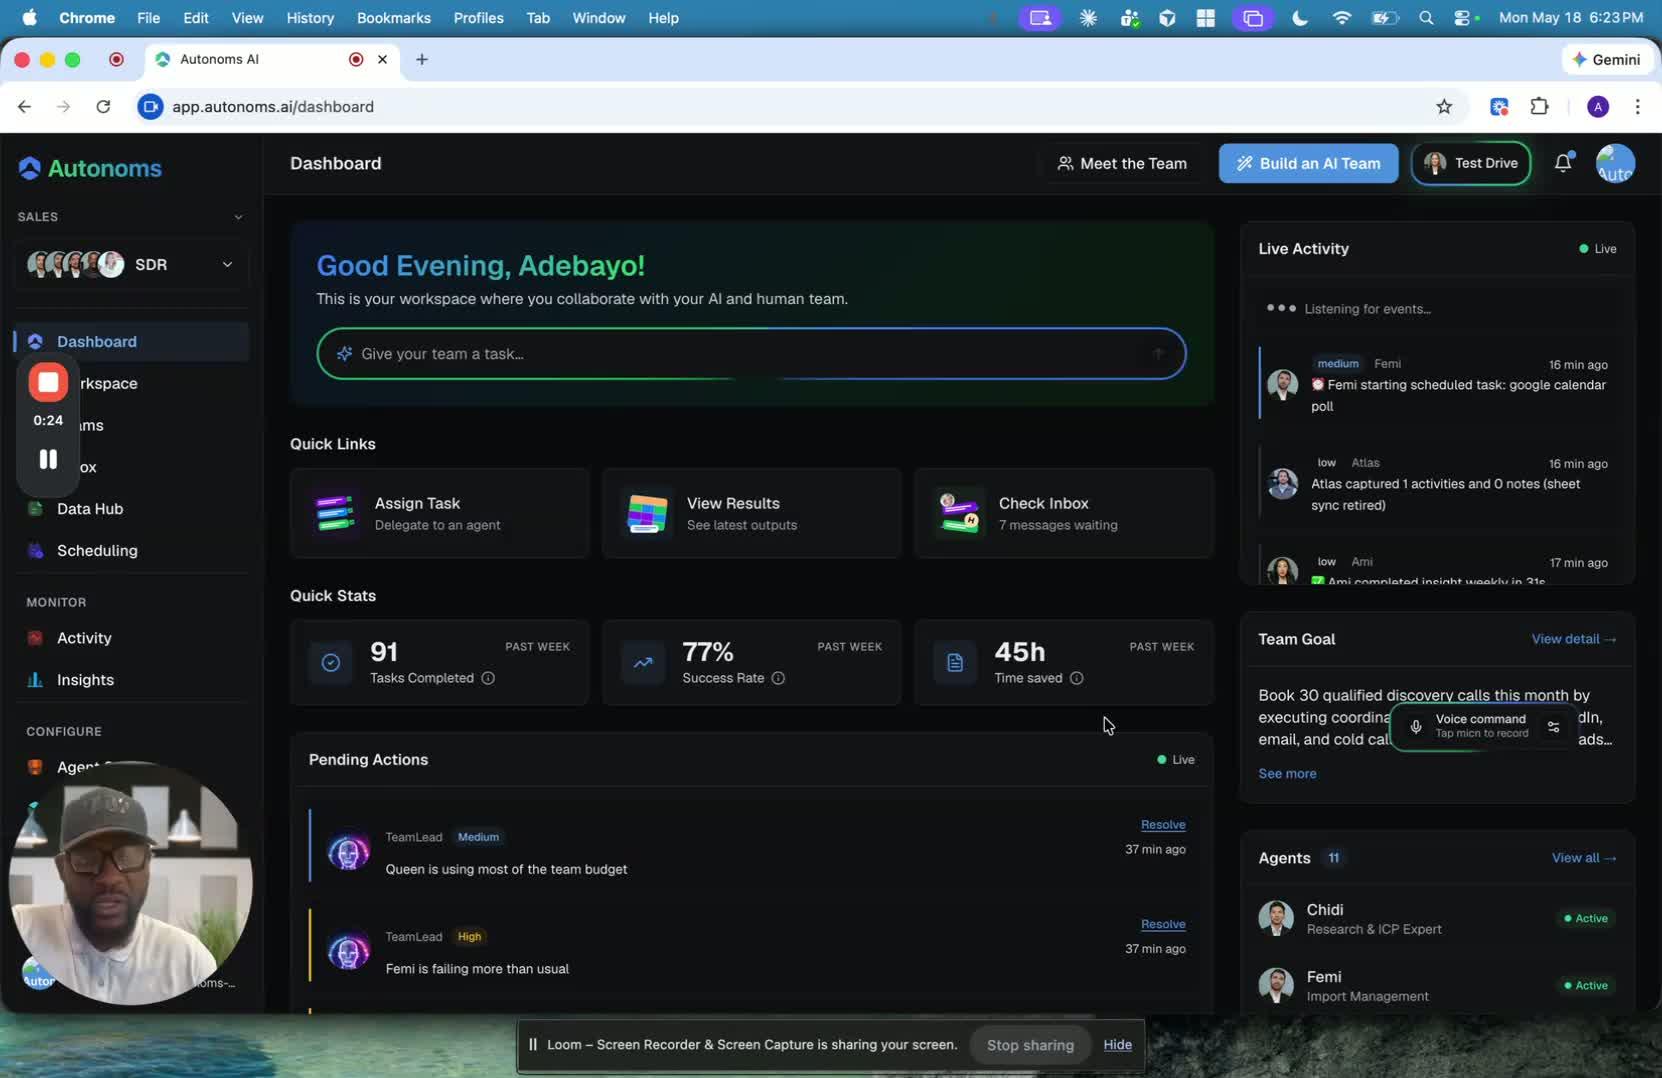
- Open the dashboard and walk through the main layout.
- Point out the menu and explain where major platform sections are located.
- Show how the dashboard serves as the central hub for monitoring activity and accessing key tools.
4. Use the dashboard to communicate with agents and monitor settings 0:41
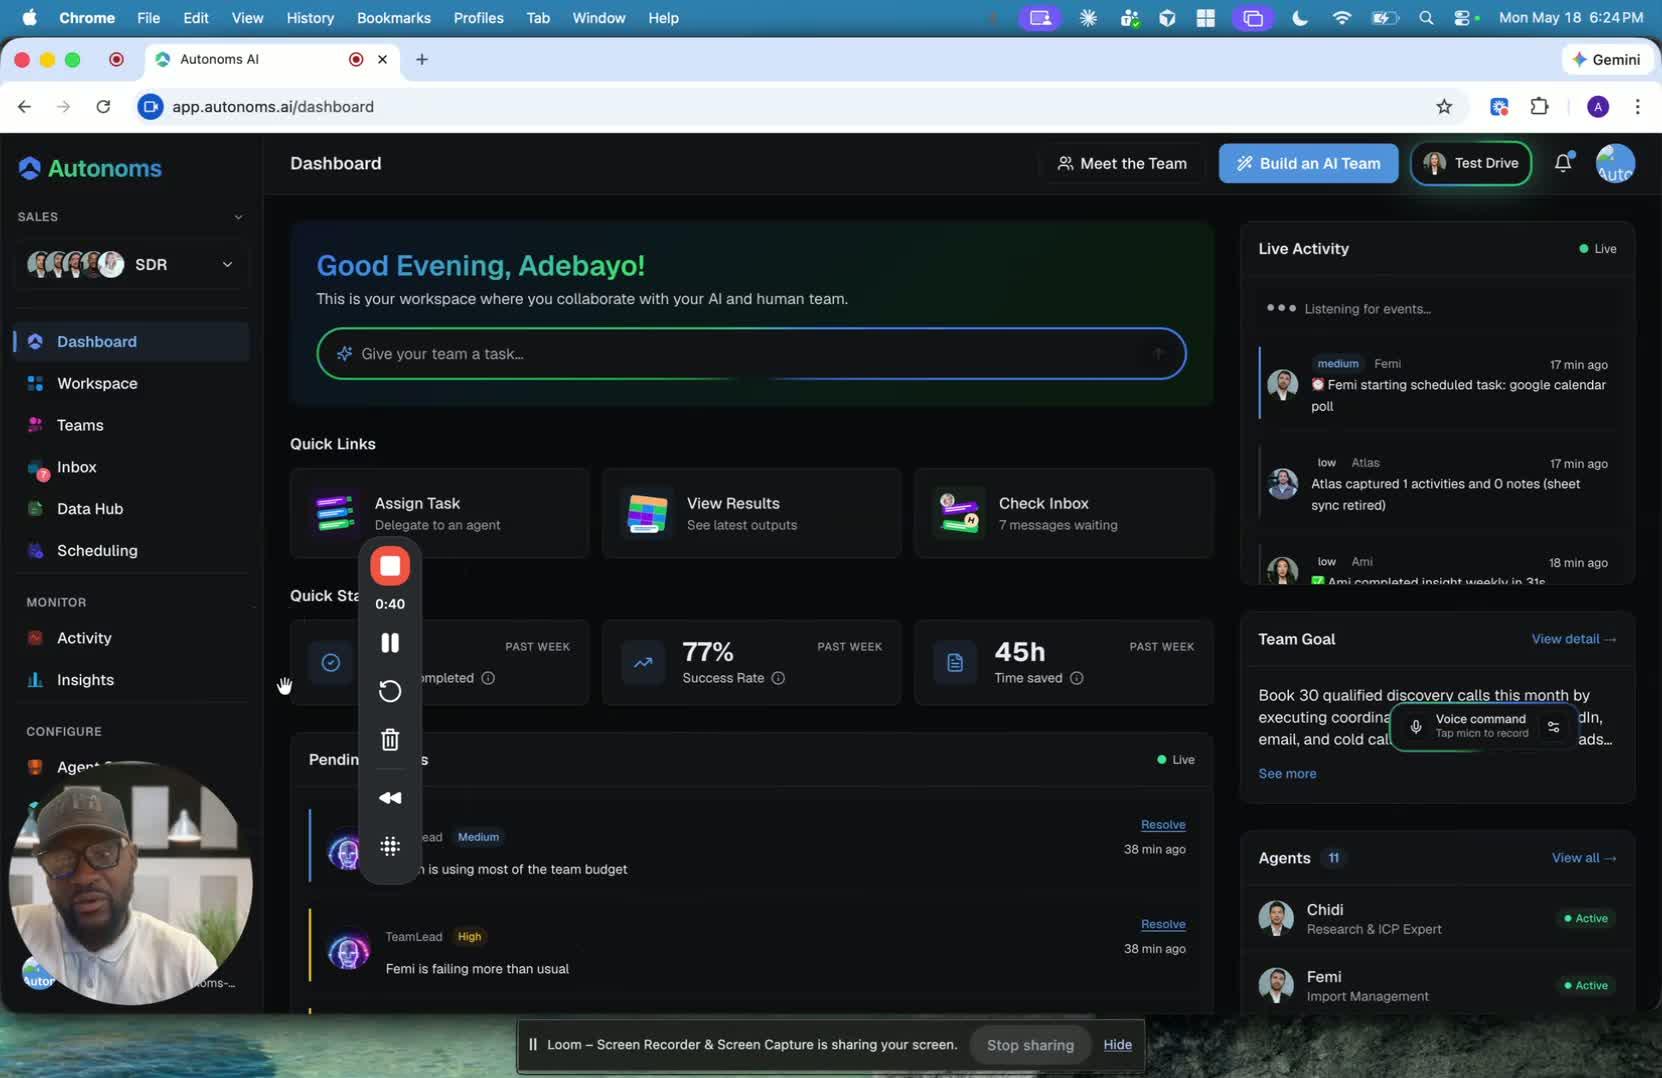
- Demonstrate how to chat directly with agents from the dashboard.
- Review the settings area and explain that it provides high-level visibility into platform activity.
- Show where to find inbox message counts, results, and other status indicators.
- Explain how delegated tasks are surfaced so the team can track work assigned to agents.
5. Interpret the summary metrics and performance indicators 0:59
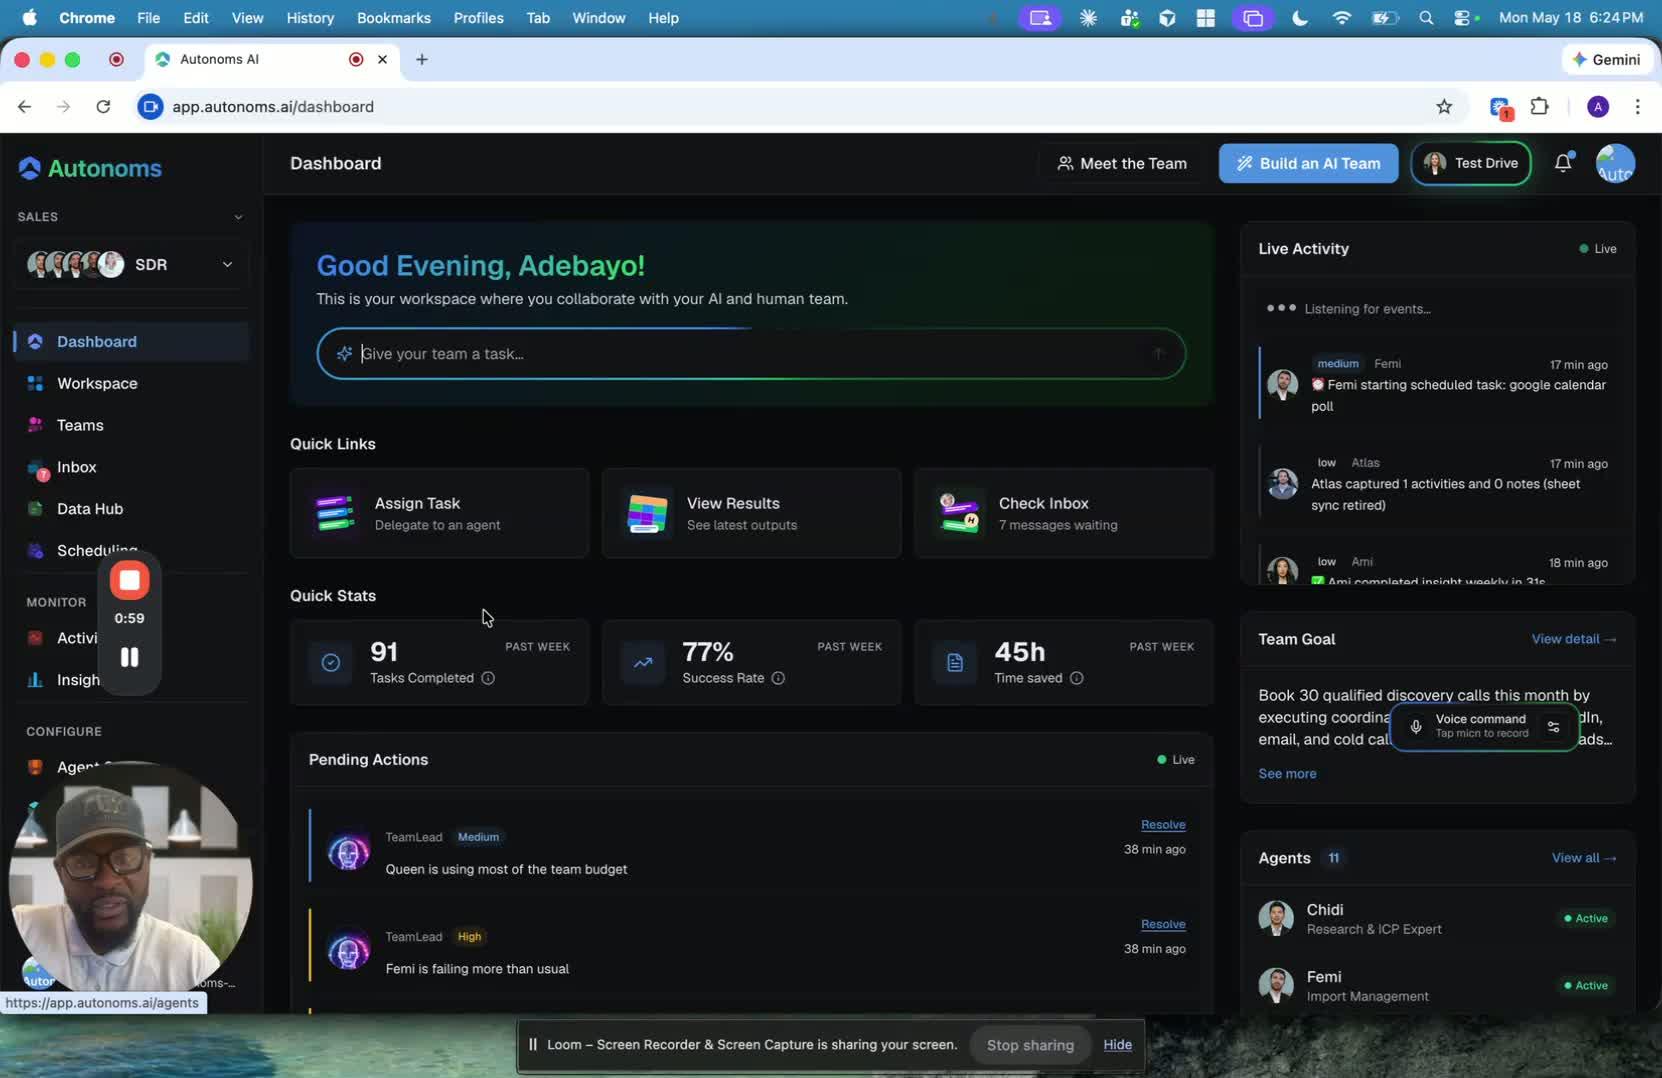
- Review the quick stats shown on the dashboard.
- Explain the meaning of key metrics such as:
- Tasks completed
- Success rates
- Time saved
- Clarify that time saved is used to compare what the platform accomplishes versus what a human team would typically need to do.
- Use these metrics to evaluate whether the platform is meeting operational goals.
6. Monitor and resolve actions that need attention 1:26
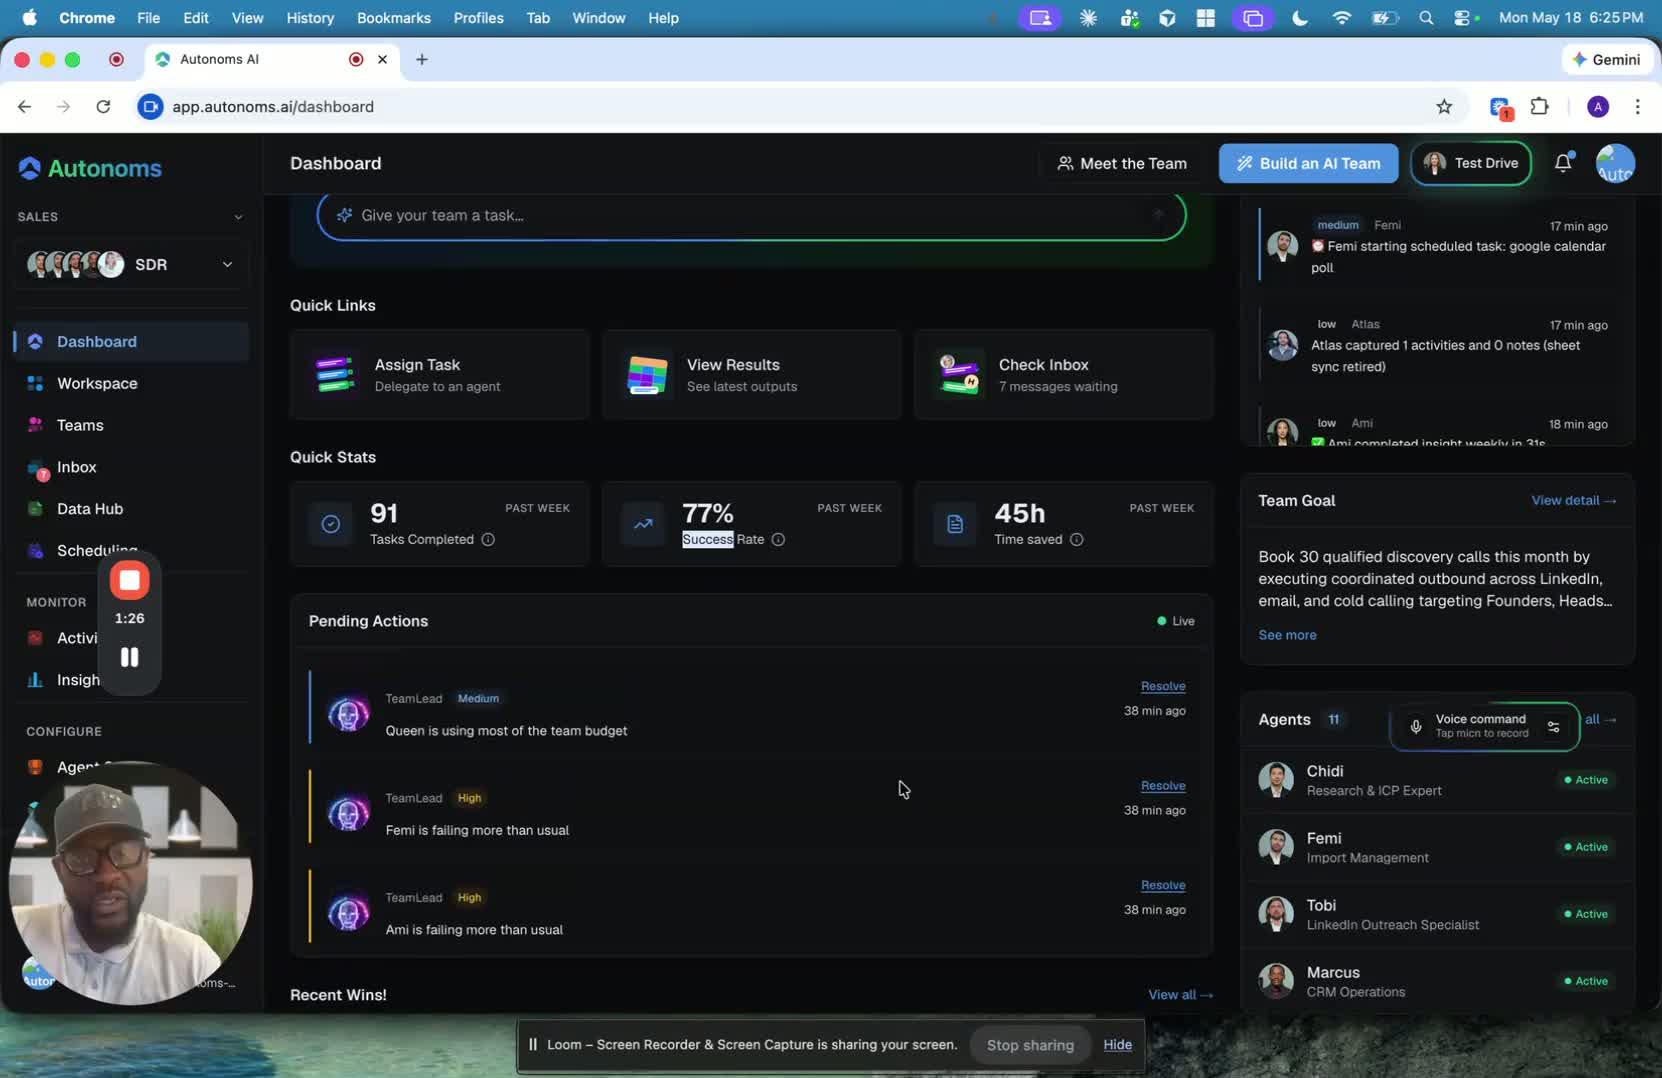
- Check the actions or alerts section for items requiring review.
- Maintain transparency about what is happening in the backend.
- Assign responsibility for resolving issues to either the user or the human-in-the-loop support role.
- Prioritize anything that could affect platform performance or reduce AI agent effectiveness.
- Resolve issues promptly to keep the system operating at its best.
7. Review wins and positive outcomes 1:52
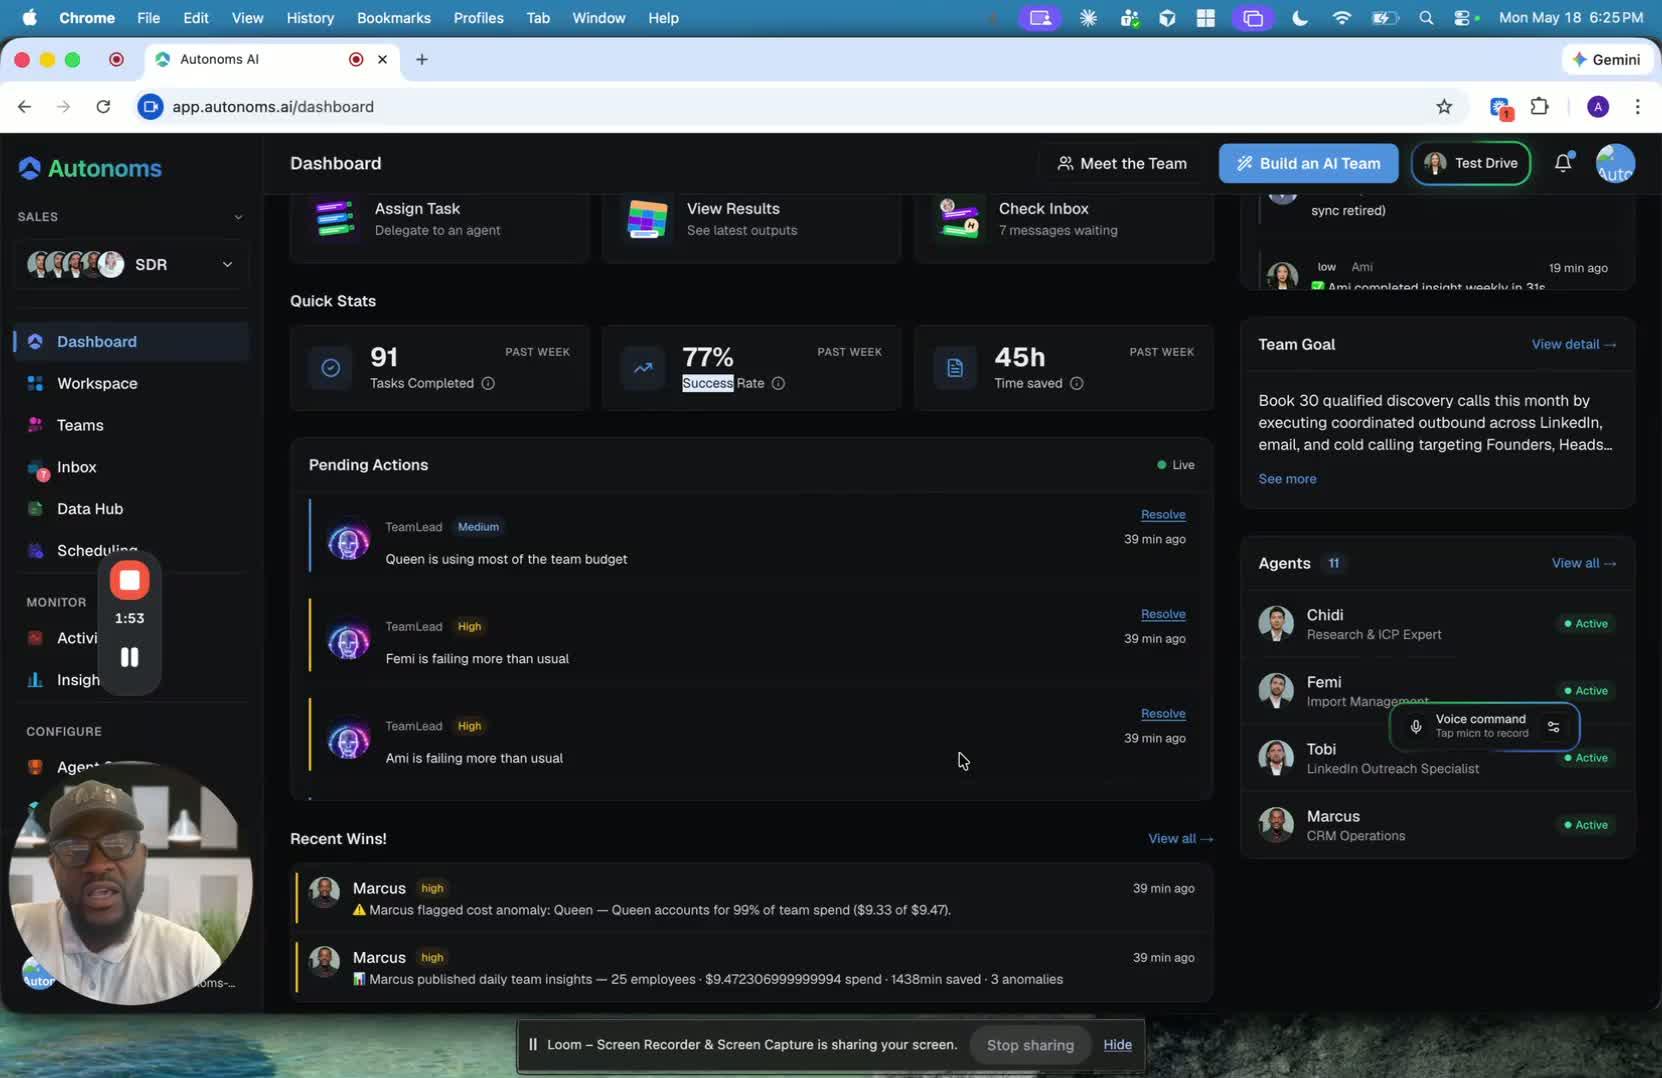
- Look at the wins section to identify successful outcomes and progress.
- Use this area to confirm that the platform is helping the team move toward its goals.
- Review examples such as qualified discovery calls or other positive performance indicators.
- If appropriate, set stretch targets to encourage the system to outperform baseline goals.
8. Check light tasks and team communication options 2:19
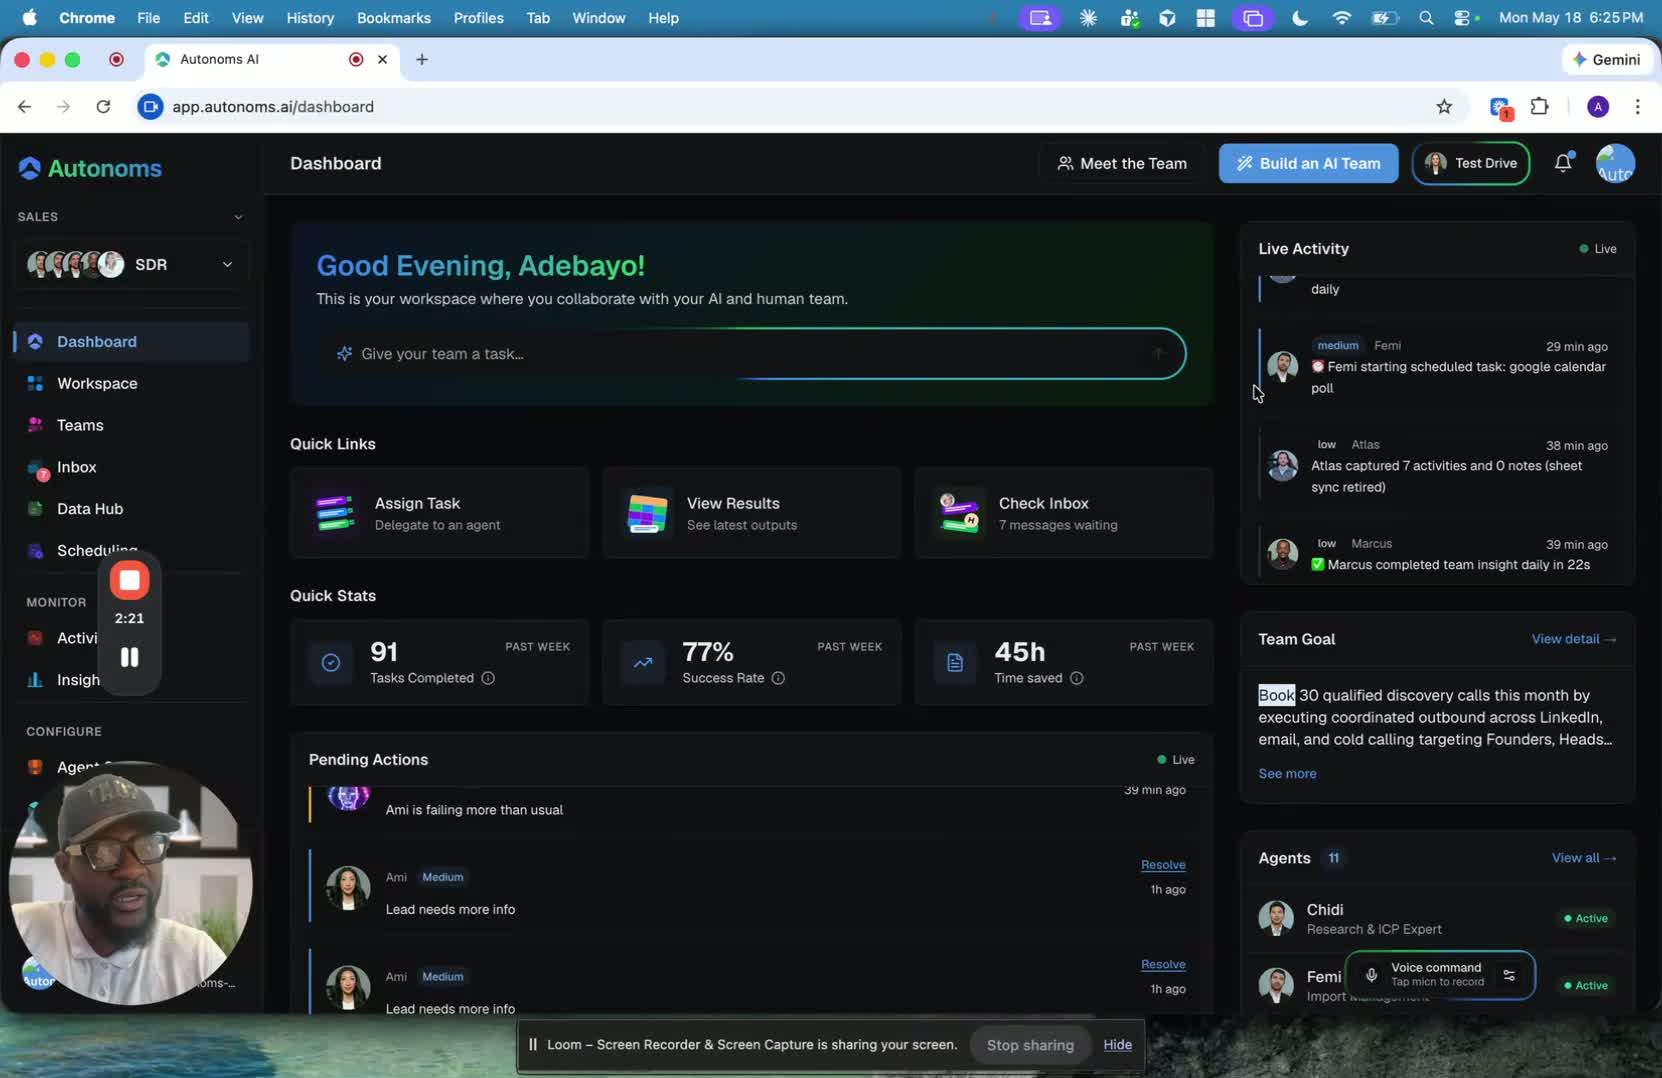
- Review any light tasks assigned in the dashboard.
- Use the dashboard to reach out to team members when coordination is needed.
- Confirm that the dashboard can support both task tracking and internal communication.
- Prepare to move into the next workspace area once the dashboard review is complete.
Cautionary Notes
- Do not treat the trial period as a long-term free subscription; it is intentionally limited.
- Be transparent when reviewing backend actions so issues are not overlooked.
- Ensure a human-in-the-loop is available to resolve items that could impact performance.
- Avoid relying only on summary metrics; verify the underlying activity when possible.
- Do not ignore alerts or unresolved actions, as they may reduce agent effectiveness.
Tips for Efficiency
- Use the one-day trial to test the platform end to end instead of exploring randomly.
- Focus first on the dashboard’s highest-value areas: messages, tasks, metrics, and alerts.
- Review success rates and time saved together to get a fuller picture of performance.
- Keep communication with team members inside the dashboard when possible to reduce context switching.
- Track wins and unresolved actions daily so trends are easy to spot.
Link to Loom
https://loom.com/share/84e11c5d54744055828e51795d1eabce
Platform Overview: Test Run, Dashboard, and Key Features
1. Understand the test-run and trial structure 0:00
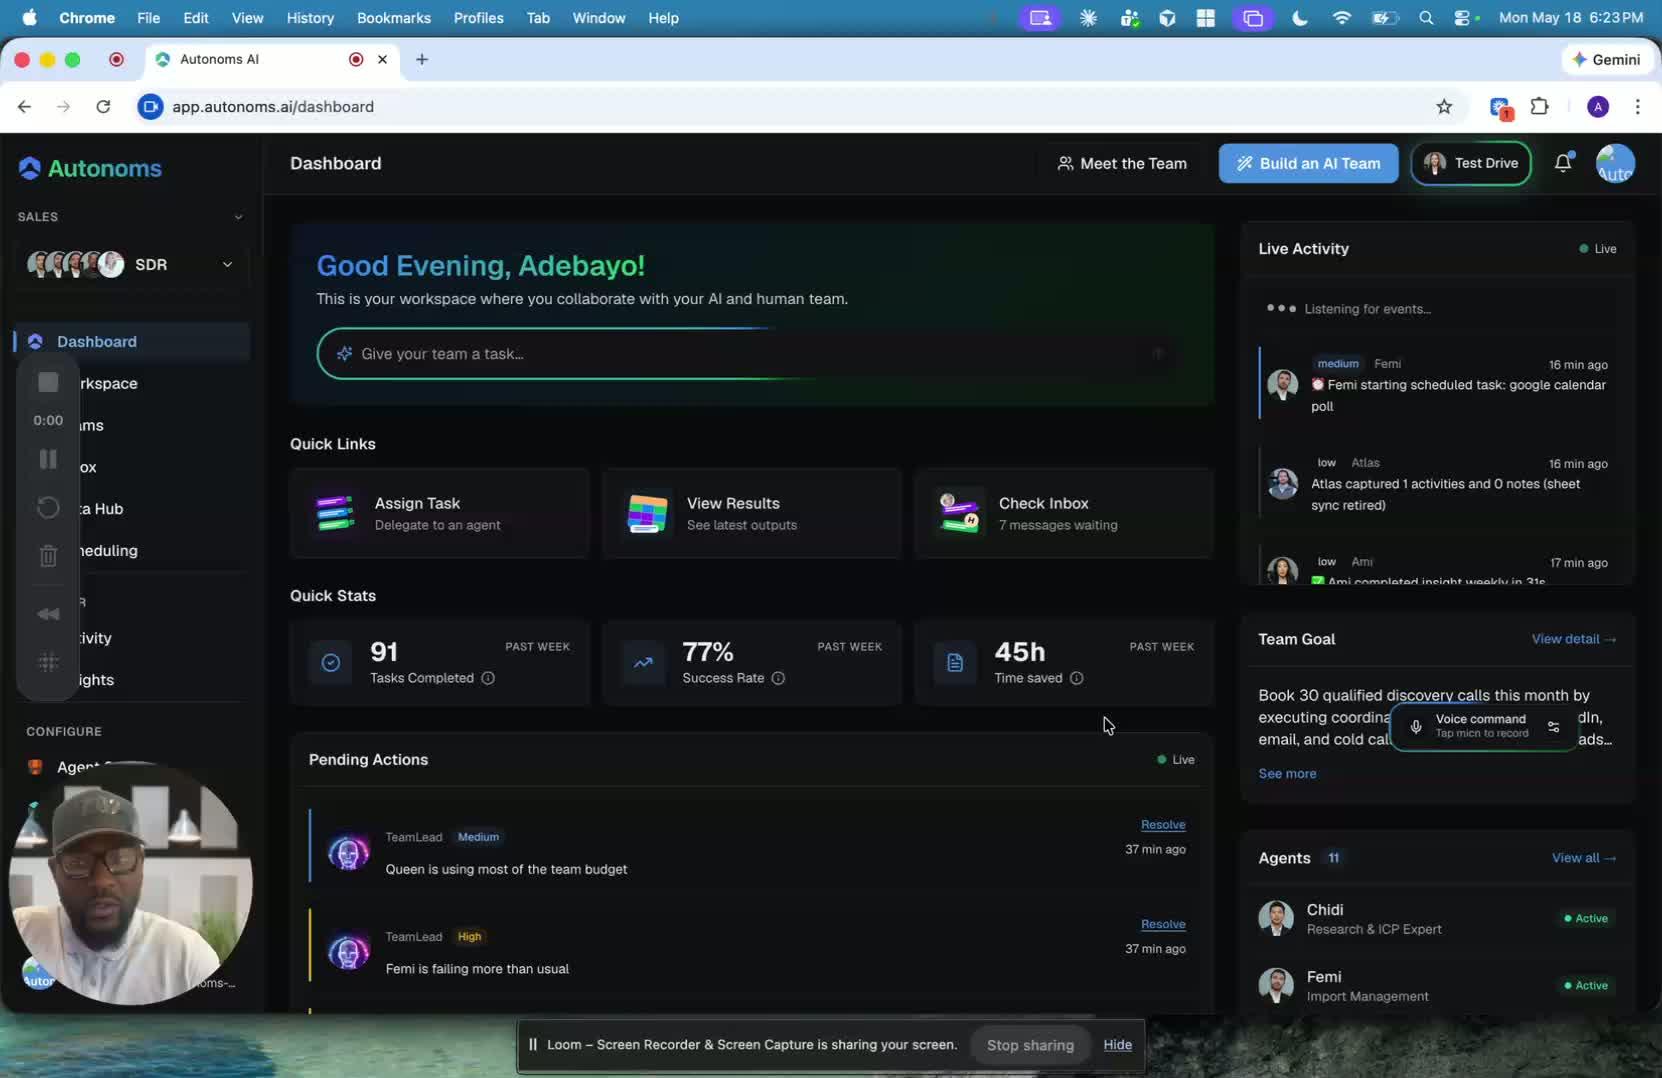
- After finishing the test run, you get one full day to explore the platform before subscribing.
- The short trial is intentional because the system is resource-intensive and cannot support long free trials.
- The purpose of the test run is to give you a real end-to-end experience of how the platform works in practice.
2. Start with the dashboard as your main control center 0:25
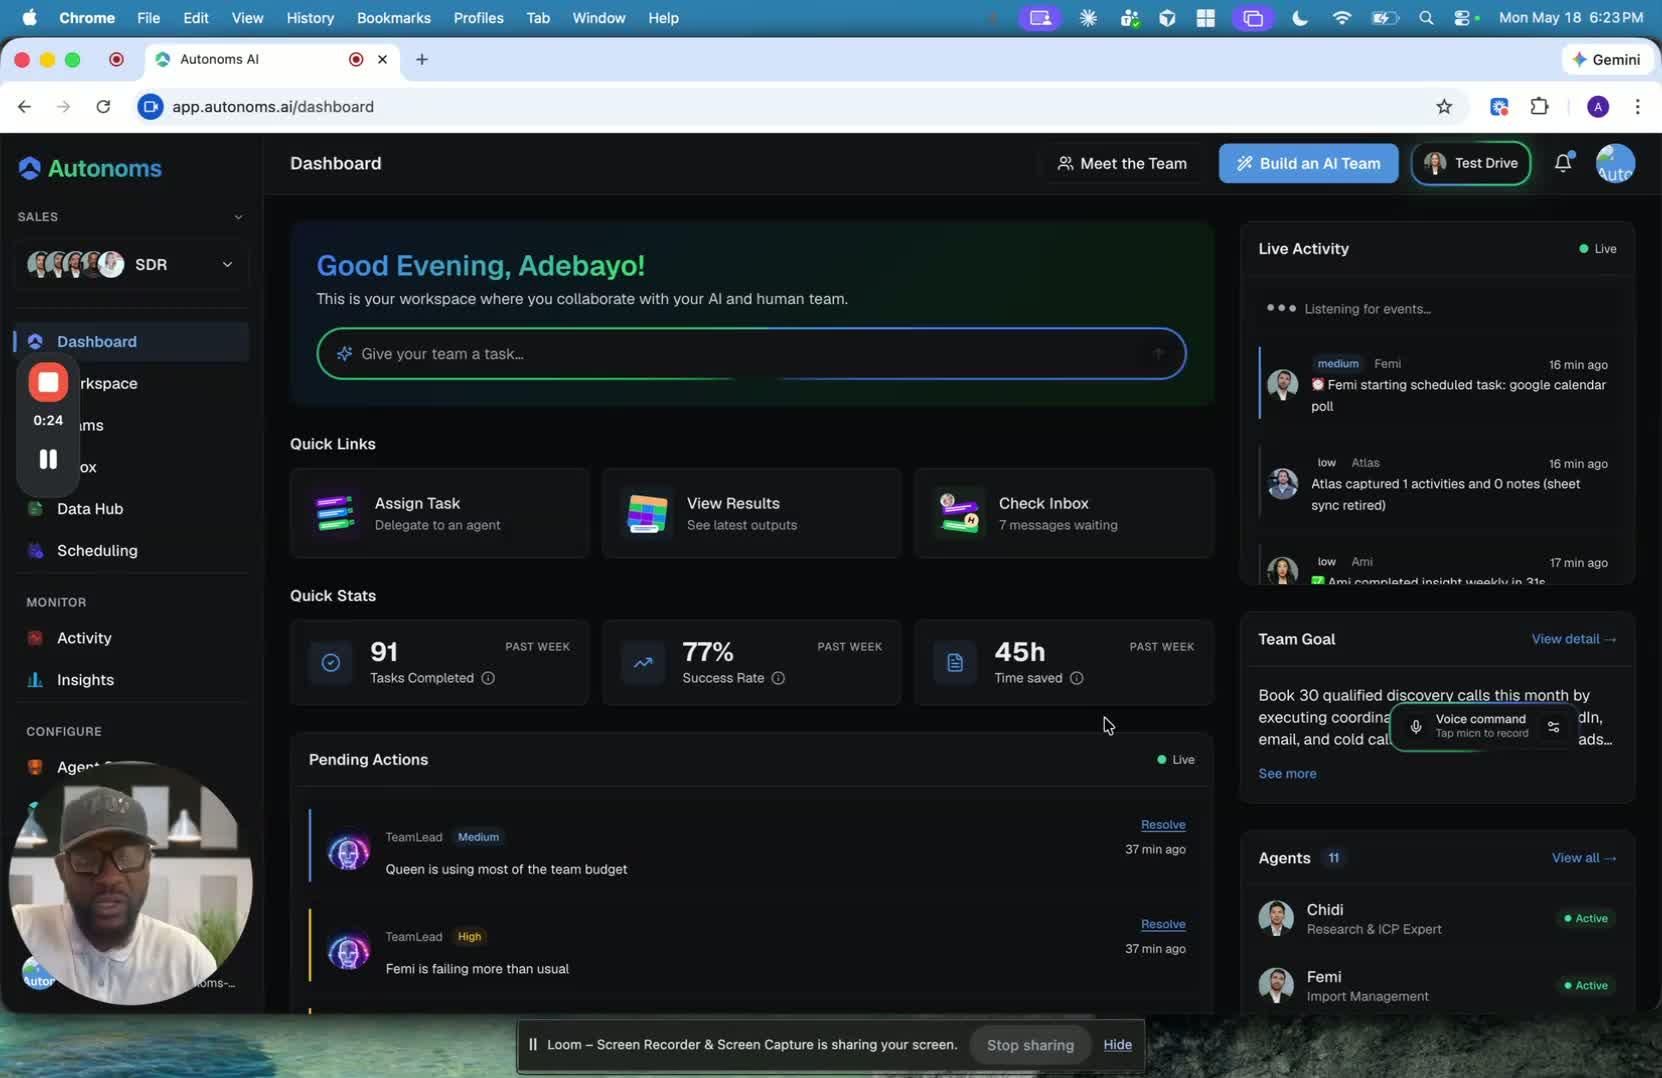
- The walkthrough begins with the dashboard, which serves as the central place to monitor activity.
- From here, you can quickly see the menu, access core areas, and get a high-level view of the platform.
- The dashboard is designed to help you understand what is happening without digging through multiple screens.
3. Use the dashboard to chat with agents and review activity 0:41
generated-image-at-00:00:41
- You can chat directly with agents from the dashboard.
- The dashboard also shows settings information and a summary of current platform activity.
- It highlights things like:
- Inbox message count
- Results and ongoing activity
- Delegated tasks assigned to agents
4. Review performance metrics and business impact 0:59
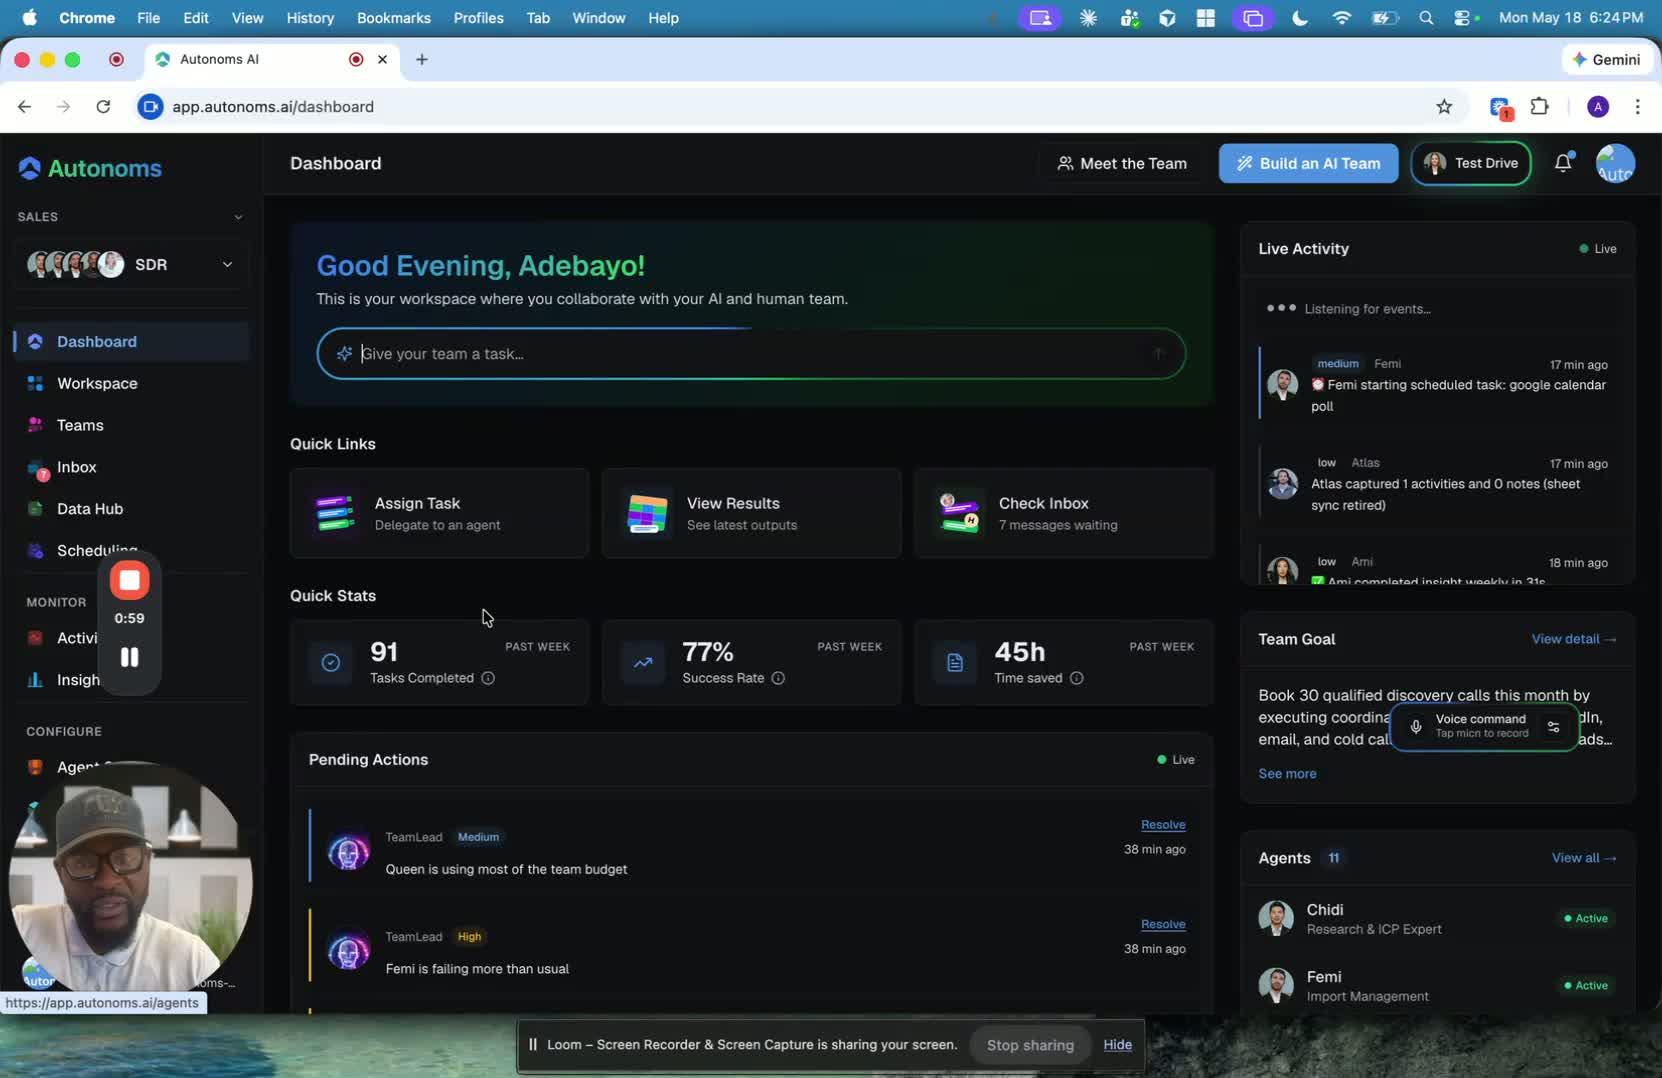
- The dashboard provides quick stats such as:
- Tasks completed
- Success rates
- Time saved
- The time saved metric is meant to show the difference between what a human team would spend versus what the system is handling.
- The platform also includes explanations for how these metrics are calculated.
5. Monitor exceptions and resolve issues transparently 1:26
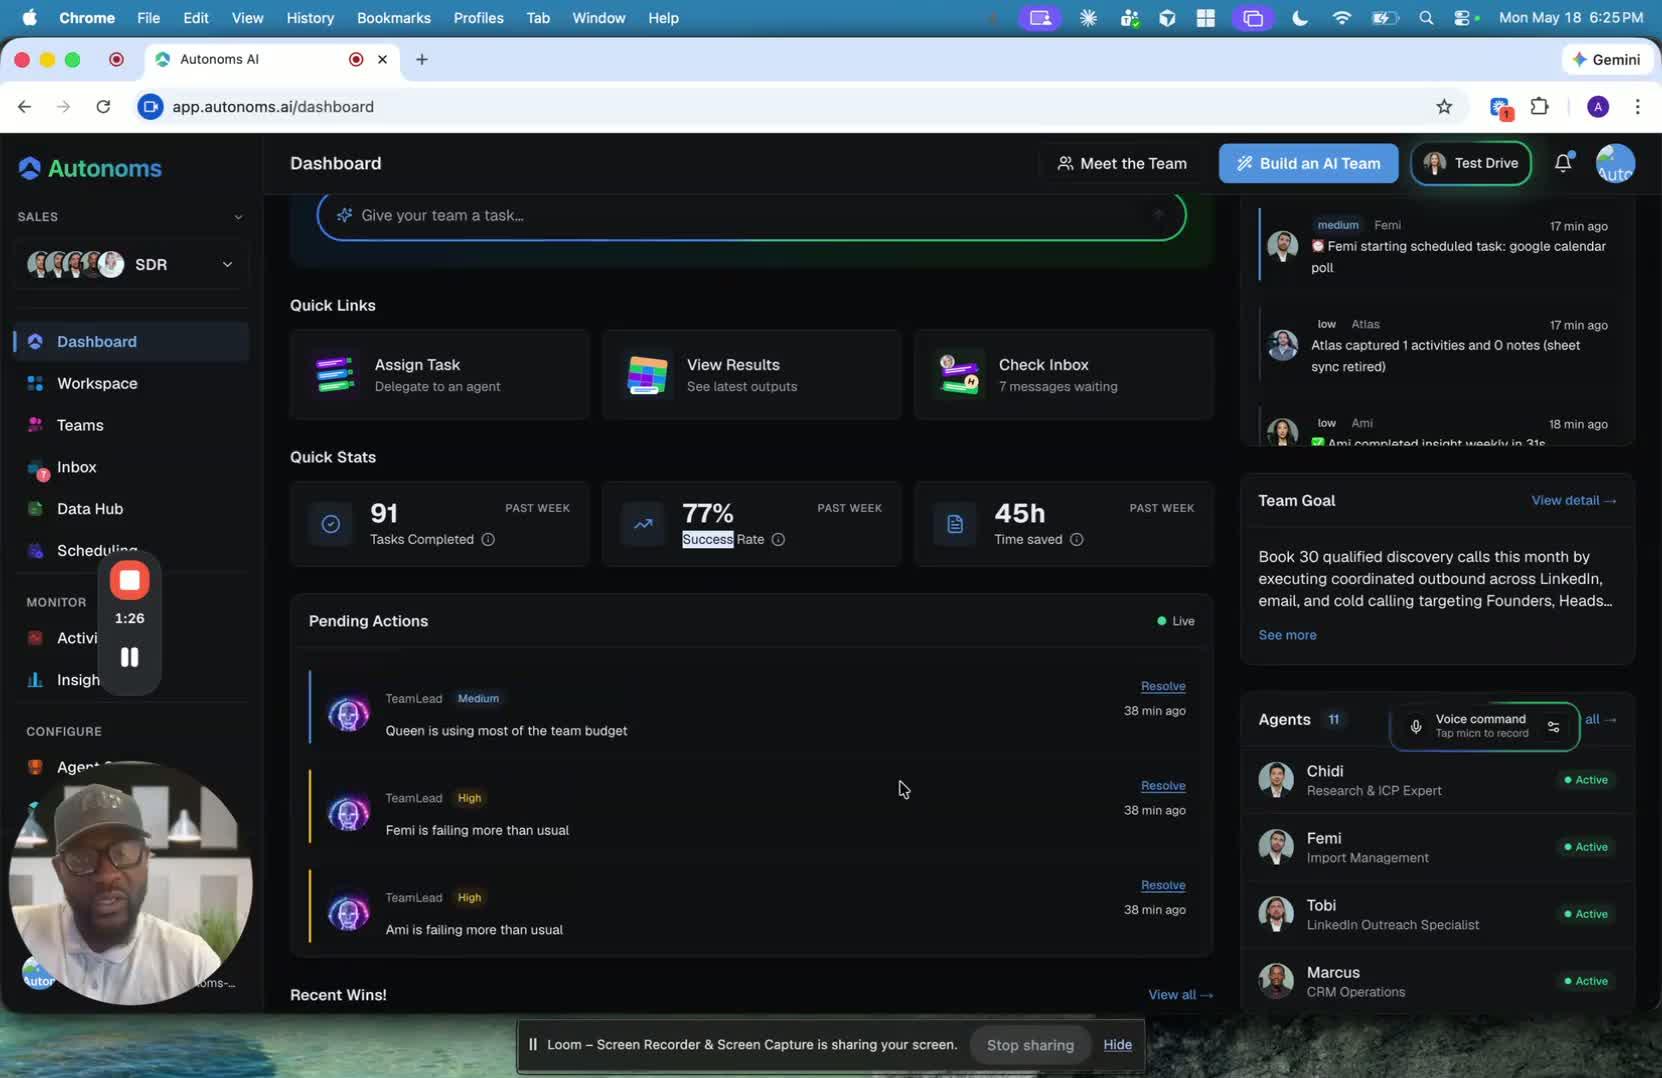
- The dashboard includes a section for actions/issues so you can see what needs attention.
- This is meant to keep the system transparent and give you a chance to resolve problems quickly.
- Either you or your human-in-the-loop team member can handle these items.
- This area is important for maintaining platform performance and helping the AI agents operate at their best.
6. Track wins and progress toward goals 1:52
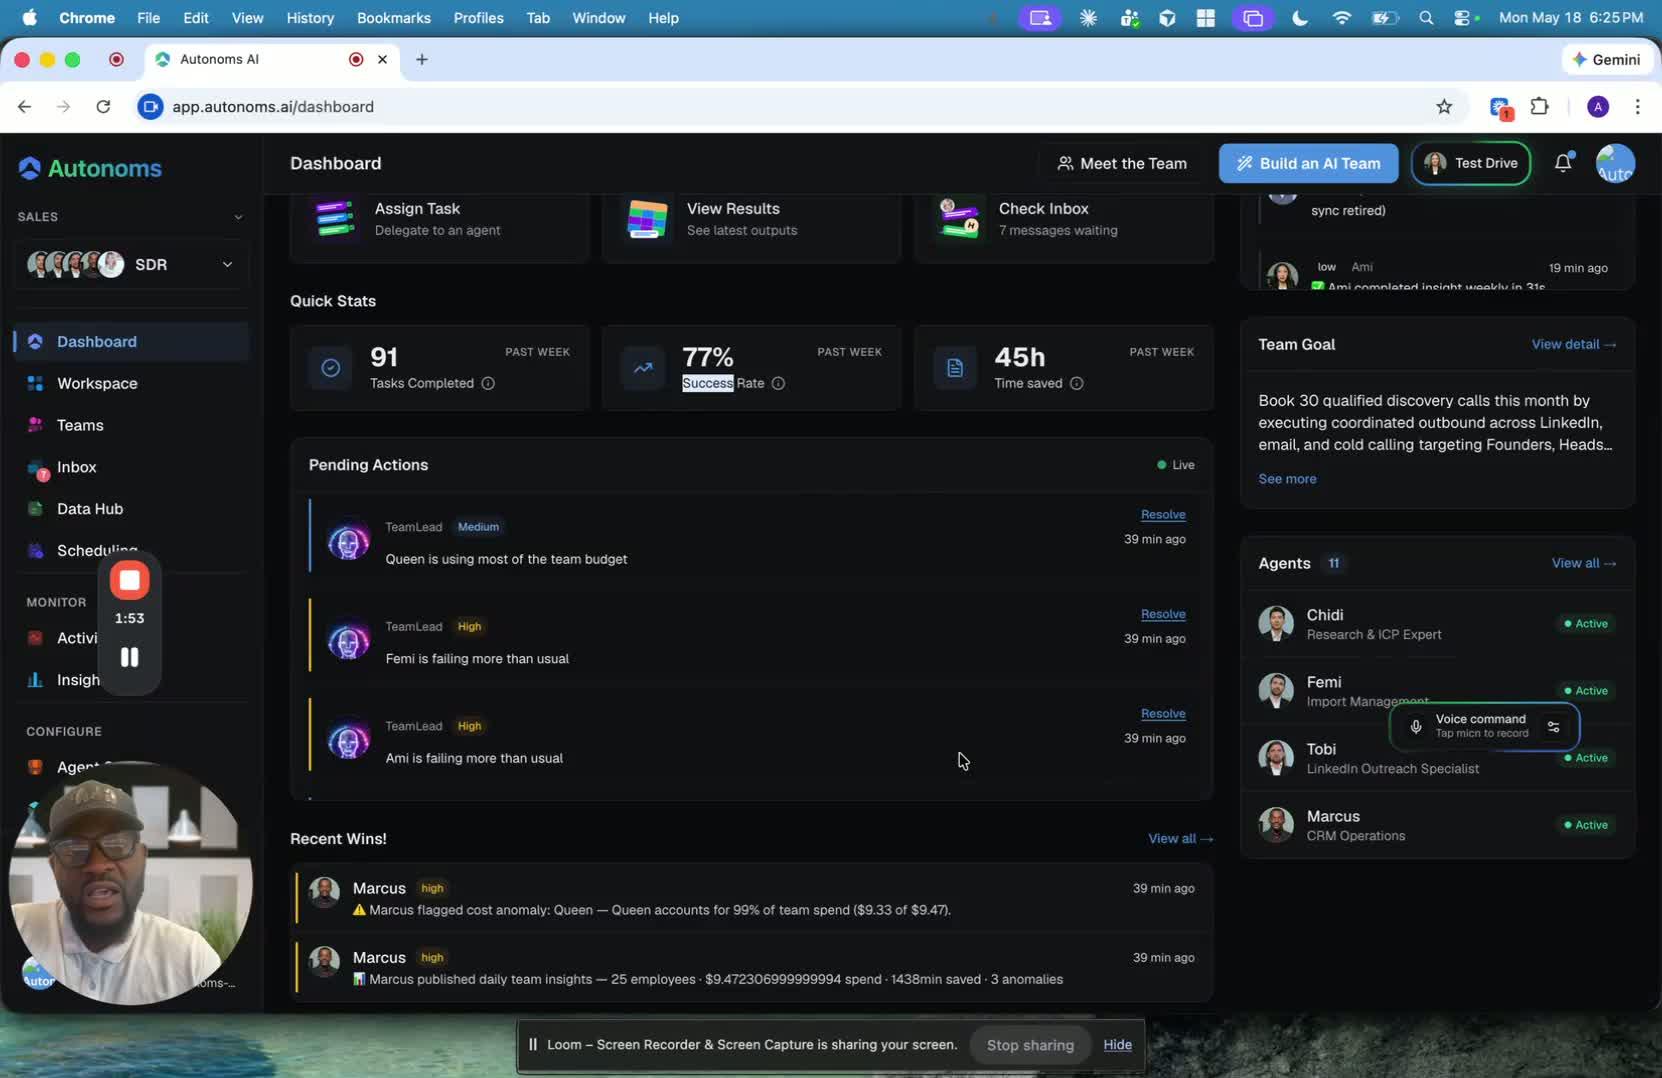
- The dashboard surfaces wins and positive outcomes happening across the team.
- Example: it may show results like qualified discovery calls.
- The system may even push performance slightly higher to help outperform your goals.
- This section is meant to keep you focused on progress and outcomes.
7. Use lightweight tasks and team communication tools 2:19
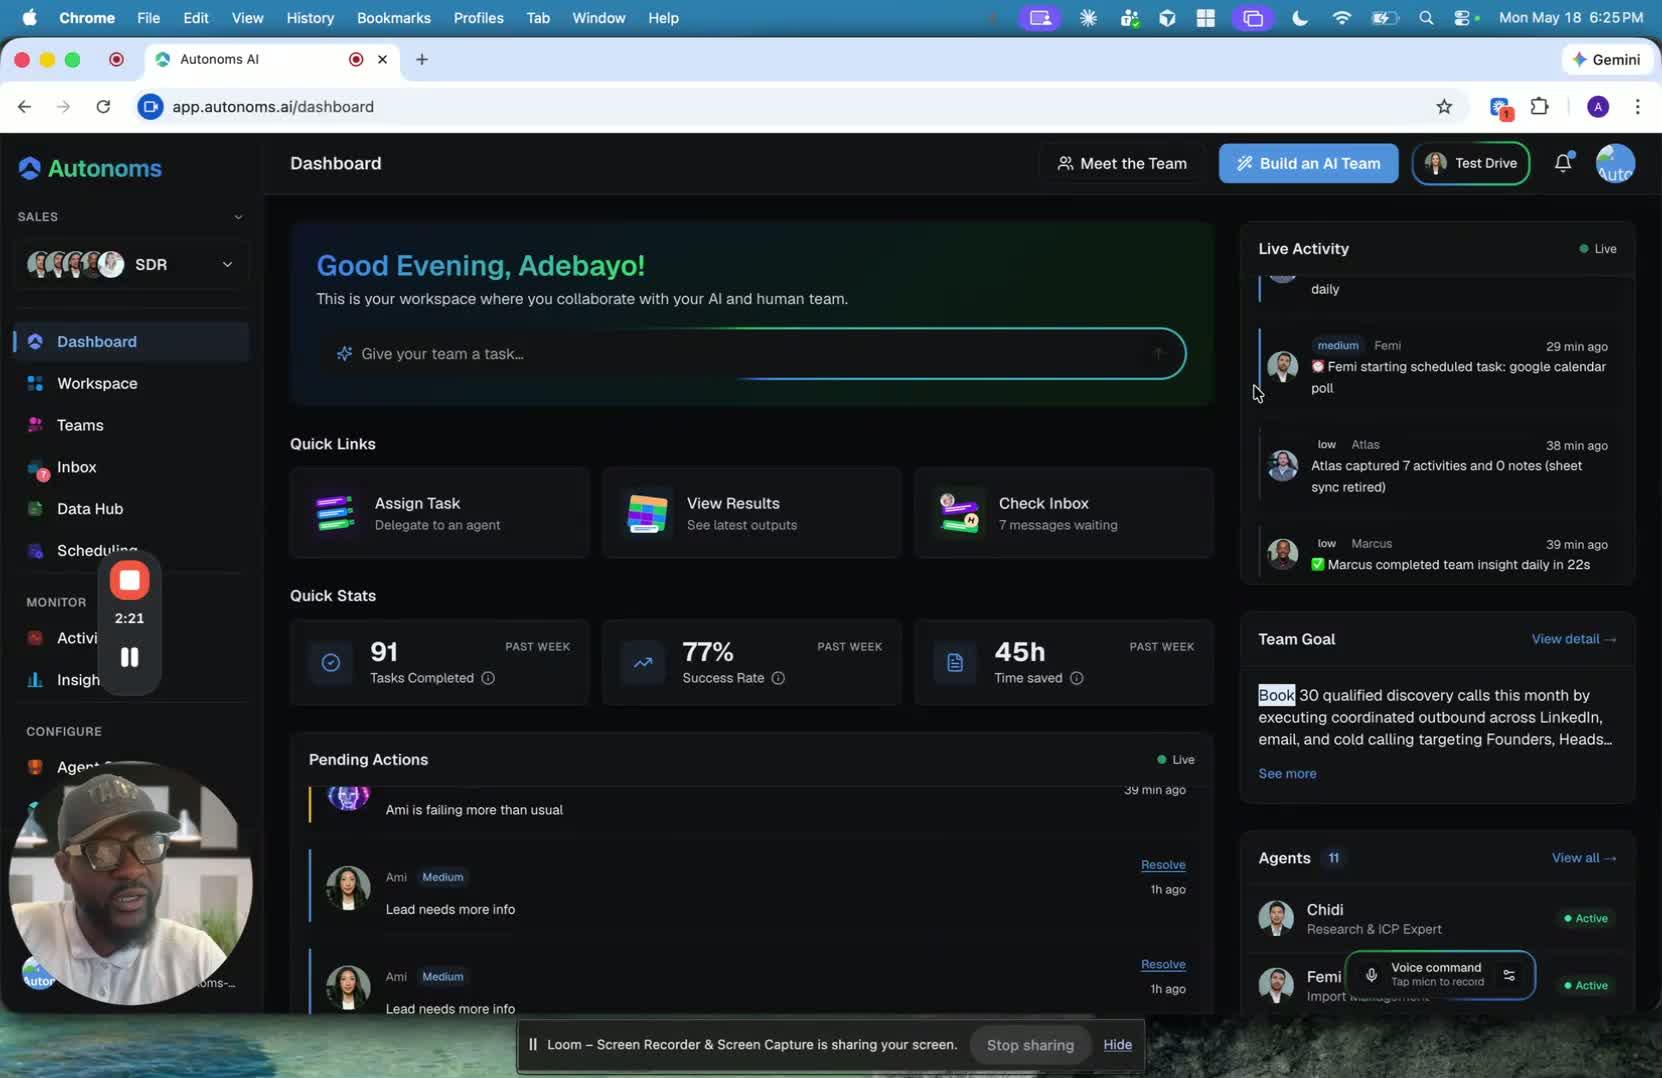
- The dashboard also includes light tasks for quick action items.
- You can reach out to team members directly from the platform.
- Overall, the dashboard gives you a fast, centralized way to:
- Monitor activity
- Respond to issues
- Track results
- Communicate with your team
8. Move on to the next area of the platform 2:27
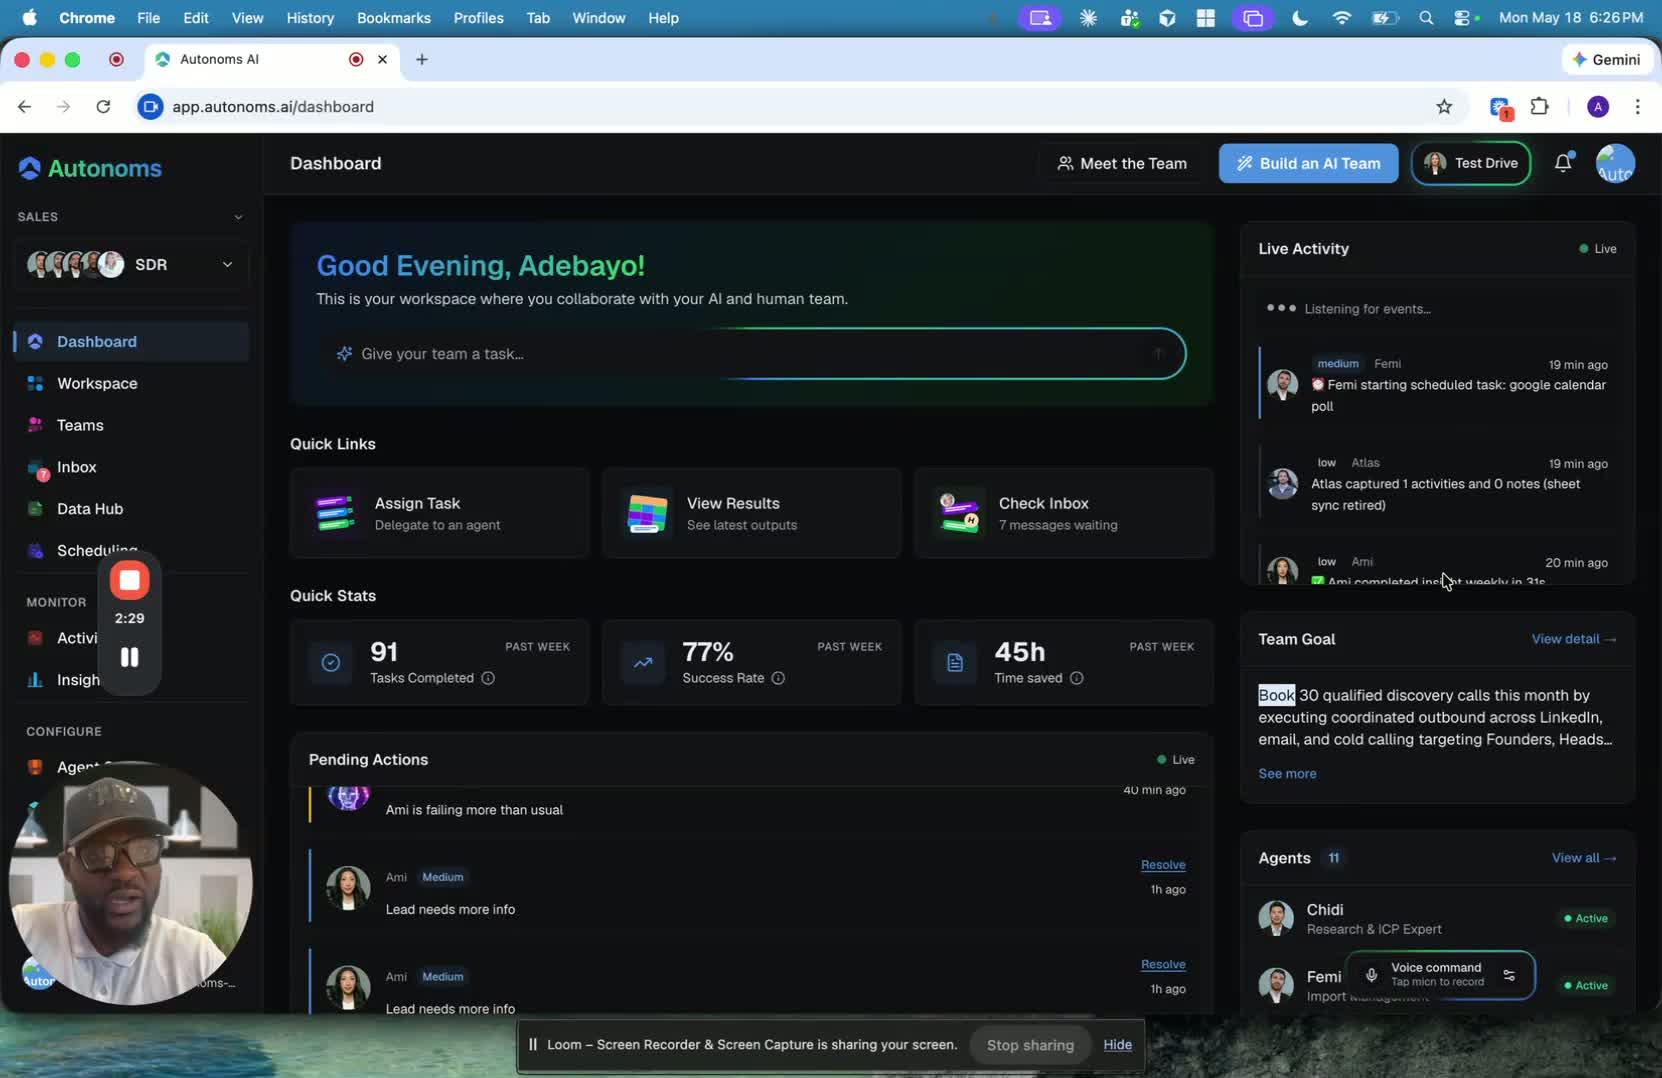
- The walkthrough ends this section by noting that the next stop is Workspace Nest.
- This signals a transition from the dashboard overview into a deeper look at other platform areas.